by M.K. Sudarshan
September 16, 2026: Chennai, India
OPINION | Don’t go calling the Indian Private Sector Investors names such as “laggards”; blame instead the Indian Consumer’s “animal
spirits”
For the past decade, a tired and predictable script has played out in the corridors of New Delhi’s ministries, the conference rooms of Mumbai’s think tanks, and the speeches of central bankers. The narrative goes something like this: The sovereign state is doing all the heavy lifting, aggressively building roads, tracks, and ports, while India’s private capitalist class sits on its hands. Corporate India is labeled over-conservative, excessively risk-averse, and desperately lacking in the bold, animal spirits that built modern economic giants.
This public chastisation is not just uncharitable; it is fundamentally bad economics.
When you strip away the political rhetoric and look at the actual hard data, a drastically different story emerges. The Indian private sector is not lazy. It is fiercely prudent, hyper-rational, and completely trapped by a structural reality that policymakers refuse to say out loud: the Indian consumer is not spending enough to justify buying a single new brick.
📊 Narrative Chapter 1: The Illusion of the Absent Capitalist
The primary weapon used to beat the private sector into submission is the claim that the government has had to step in because private investment has vanished. Let us disabuse ourselves of that myth immediately by looking at the long-term structural volume of capital flowing through the Indian economy over the last three decades.
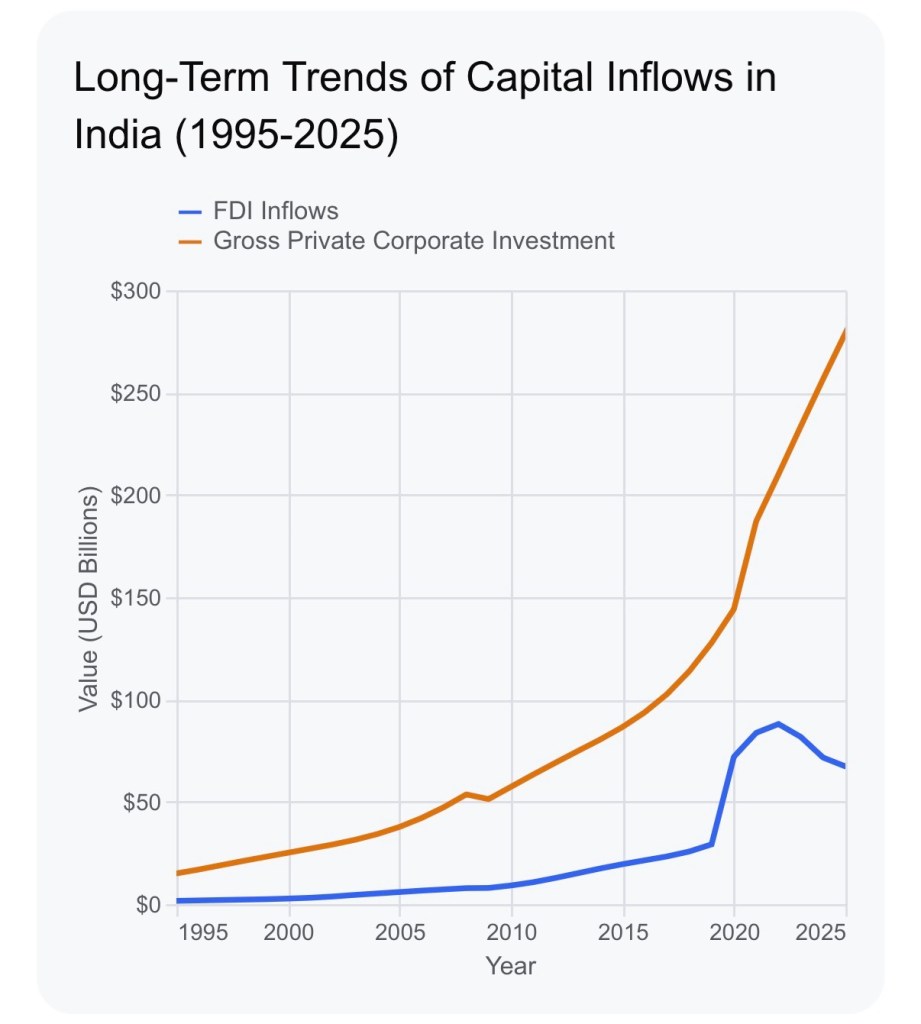
As the long-term trend lines reveal, gross private domestic capital formation is the undisputed, gargantuan engine of the Indian economy. Even during the much-discussed “deleveraging decade” following the mid-2000s balance sheet crisis, the absolute volume of private sector asset generation remained massive, utterly dwarfing headline-grabbing metrics like Foreign Direct Investment (FDI).
The capitalist class never stopped investing; they simply stopped gambling. Stung by the toxic debt of the early 2010s, corporate boards spent years systematically repairing their balance sheets. Today, corporate India boasts some of the cleanest ledgers in the world. They have the cash, they have the borrowing power, and they have the capability. What they lack is an order book.
📊 Narrative Chapter 2: The Multi-Layered Tug of War
The plot thickens when we overlay public sector spending onto this matrix. The mainstream complaint assumes that the central government’s post-2020 infrastructure blitz is carrying the entire nation because the private sector is hiding in the shadows.
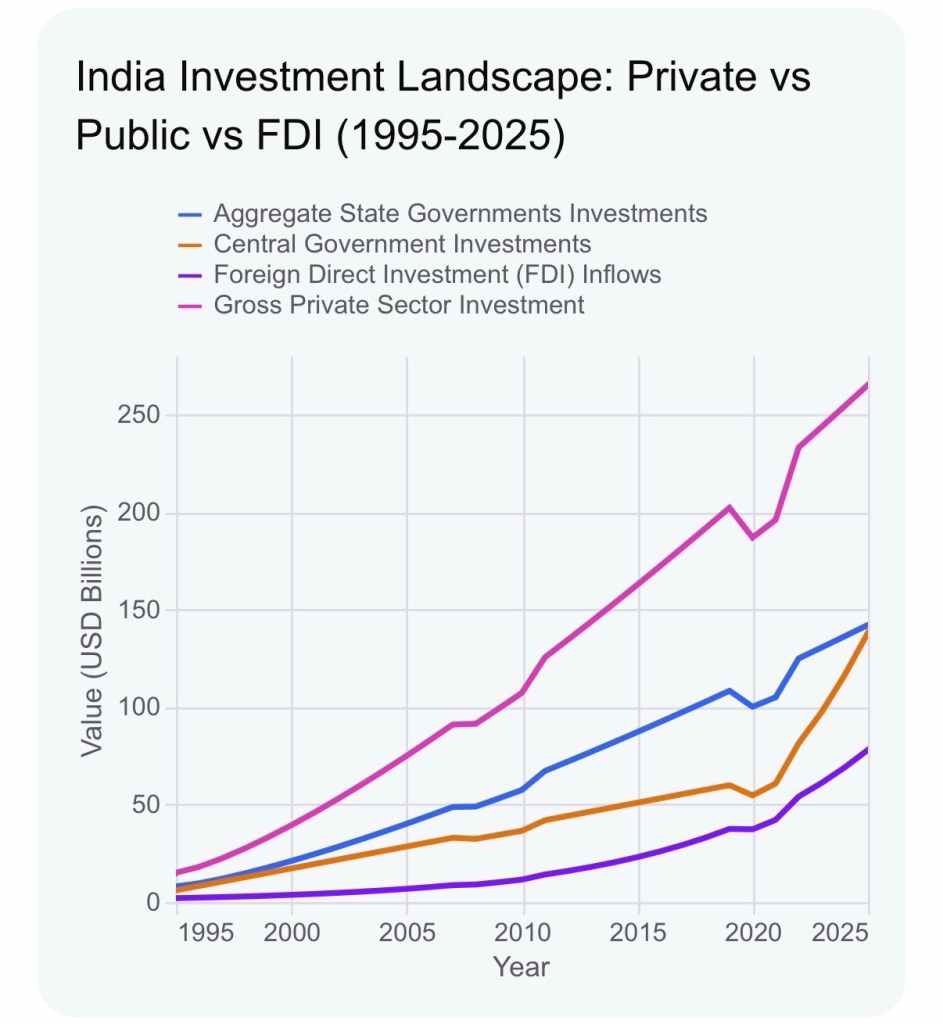
When you break down the state apparatus, a highly telling dynamic appears. For decades, the aggregate capital expenditure of all Indian states combined significantly outpaced the central government’s direct asset creation. It is the states that lay the local pipes, build the rural roads, and set up the industrial zones.
Post-2020, the central government initiated a massive structural pivot, aggressively scaling its own CapEx line to close the gap with the states. This was a deliberate policy choice to “crowd in” the private sector. The government effectively said: “We will build the logistics backbone so you can build the factories.”
📊 Narrative Chapter 3: The Reality of the Sovereign Collective
When we merge the central infrastructure budget with all aggregate state spending into a single, unified “Total Public Investment” trendline, the true macroeconomic layout is completely illuminated.
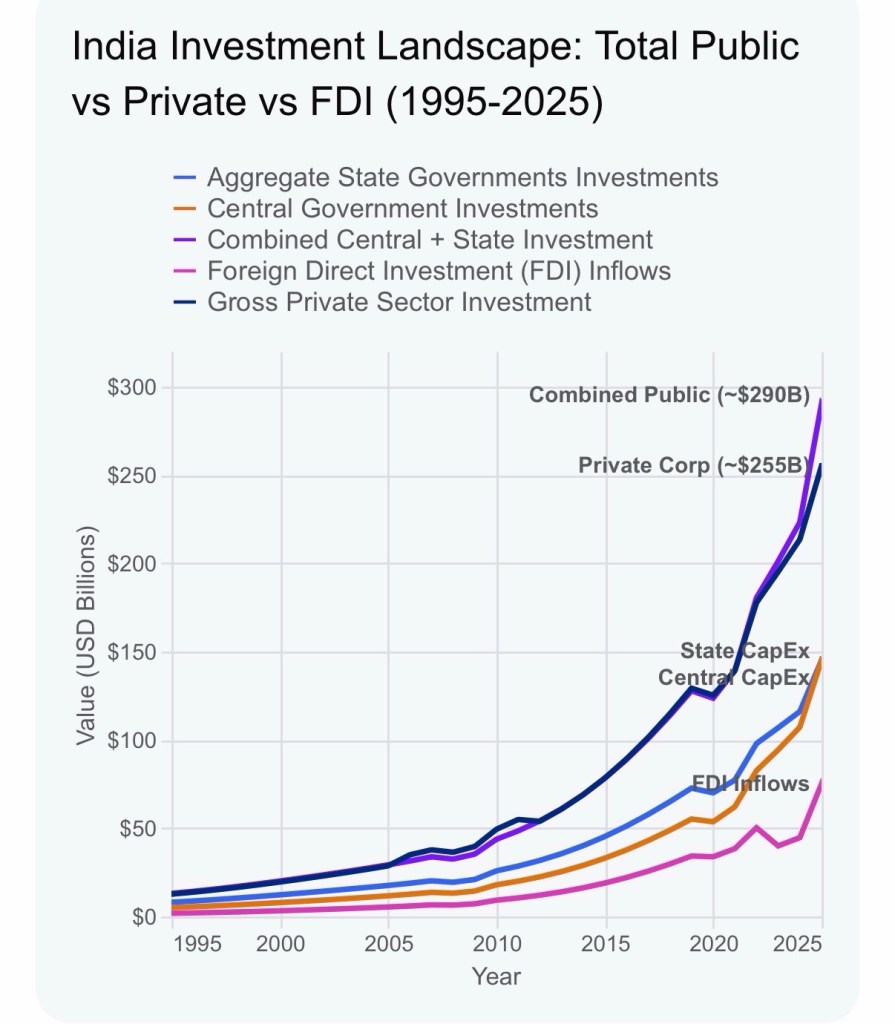
Look closely at the graph above. Gross private sector corporate investment is running neck-and-neck with the entire aggregate weight of the Indian sovereign state apparatus combined.
To call a sector that matches the collective fiscal spend of the Center and 28 states a “laggard” is mathematically absurd. The private sector is carrying half the sky. The friction isn’t the absolute height of the private sector line; it is the slope. The state wants the private line to shoot exponentially upward, breaking past the public curve. But the private sector refuses to take the bait. Why?
🧮 The Equation That Blows the Misconception
Corporate boards do not make multi-billion dollar investment decisions based on national pride or ministerial encouragement. They operate on cold, hard, deterministic economic algebra.
The entire debate surrounding India’s investment drought can be entirely encapsulated and blown apart by a fundamental macroeconomic behavioral equation:
\(I_{t}=\alpha \cdot \max (0,\ CU_{t}-CU^{*})+\beta \cdot \Delta Y_{t}\)
Let us break down the reality of this math to understand exactly why the private sector is acting with perfect sanity:
- \(I_{t}\) represents the Gross Private Investment that the government desperately wants to see rise.
- \(CU_{t}\) is the Current Capacity Utilisation of India’s existing factories.
- \(CU^{*}\) is the Critical Target Threshold—historically established as the 80% trigger line.
- \(\Delta Y_t\) is the rate of change in Aggregate Consumer Demand.
According to the latest Reserve Bank of India (RBI) OBICUS data, India’s aggregate capacity utilization hovers around 77.4%, with the seasonally adjusted reality dropping back down to 75.2%. In labor-heavy, high-employing consumer sectors like Textiles and FMCG, utilization remains deeply depressed in the low 70s due to highly uneven, rural consumption stress.
Now, perform the basic algebra. If current capacity utilization (\(CU_{t}\)) is \(75\%\), and the target threshold (\(CU^{*}\)) required to justify a new factory is \(80\%\), then \((75\% – 80\%) = -5\%\). The equation explicitly dictates taking the \(\max(0, -5\%)\), which yields exactly Zero.
When a factory owner can easily meet all their current client orders by running their existing assembly lines for just three-quarters of the day, building a brand-new factory is not “bold vision”—it is institutional suicide. The term \((CU_t – CU^*)\) must be firmly positive before private investment (\(I_{t}\)) can structurally accelerate.
The Verdict: Fix the Consumer, Fix the Engine
The private investment engine is stuck in a holding pattern because the consumer demand engine (\(\Delta Y_t\)) is highly uneven. Wealthy urban centers are buying premium electronics, but mass-market, rural, and middle-class disposable income has been severely squeezed by inflation and uneven wage growth.
Because factory utilization is trapped below the 80% line, the investment trigger remains locked. And because new investments aren’t happening, the economy fails to generate high-volume, high-emolument, formal blue-collar jobs. This creates a circular trap: weak wage growth leads back to weak consumer demand.
It is time to stop scolding India’s corporate leaders for being rational stewards of capital. They aren’t lacking vision; they are simply looking at their order books. If policymakers want the private sector to build the factories of tomorrow, they need to stop obsessing over corporate behavior and start focusing on the financial health, purchasing power, and disposable income of the average Indian consumer.
(Concluded)
Notes :
📊 Graph 1 Source: Gross Private Corporate Investment vs. FDI Inflows
- Private Sector Metric: RBI Handbook of Statistics on the Indian Economy(Table: Institutional Sector-wise Gross Capital Formation / Gross Fixed Capital Formation). This registers corporate private sector asset additions based on the Ministry of Statistics and Programme Implementation (MoSPI) national accounting frames. [1, 2]
- FDI Inflows Metric: RBI Database on Indian Economy (DBIE) (Table: Foreign Investment Inflows – Balance of Payments data). This records gross direct foreign equity inflows routed through statutory equity filing platforms into the domestic market. [1, 2]
📊 Graph 2 Source: Private Corporate vs. Isolated Public Layers
- Central Government Metric: Ministry of Finance Union Budget Documents(Table: Budget at a Glance – Capital Expenditure Actuals & Revised Estimates). This tracks the Union’s direct outlays toward creation of national physical infrastructure capital. [1, 2]
- Aggregate State Governments Metric: RBI Annual Report on State Finances(Table: Capital Expenditures / Capital Outlays of All State Governments Combined). This sums up the synchronized development expenditure across India’s respective state treasuries.
📊 Graph 3 Source: Combined Public (States + Centre) vs. Gross Private Corporate
- Combined Government Metric: Synthesized dynamically by aggregating the Union Budget Profiles with the collective RBI State Finance Database records. It measures the sovereign’s total effective capital expenditure footprint on the economy against the private corporate baseline.