The Shared Tragedy
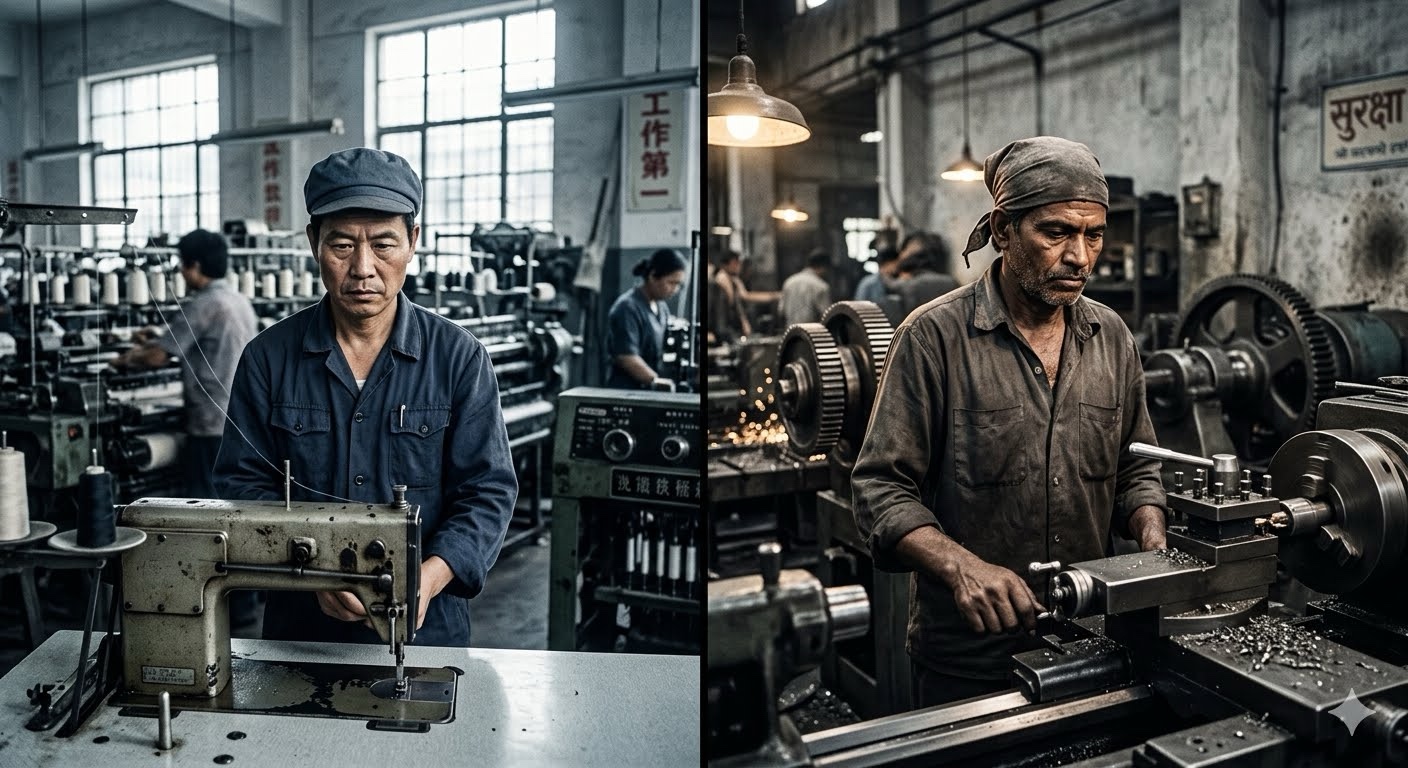
A blue-collar factory worker in Dongguan, China, and a white-collar IT contractor in Bangalore, India—separated by the Himalayas and 3,000 miles—have something heartbreaking in common: over the past decade, both have watched capital owners capture 4–6 times more wealth per person than they did, despite their nations’ spectacular economic growth.
In China, GDP grew 76% from 2014–2024. In India, it grew 93–165%. But labour’s share of this boom? A mere 30–34%, and when divided per capita among 625–774 million workers, the gains evaporate into thin air.
This is not a story of democracy vs. autocracy. It is a story of how economic structure trumps political system when it comes to distribution.
THE SCALE OF THE CRISIS: ONE THIRD OF HUMANITY
The Most Important Population Statistics You’ve Never Heard
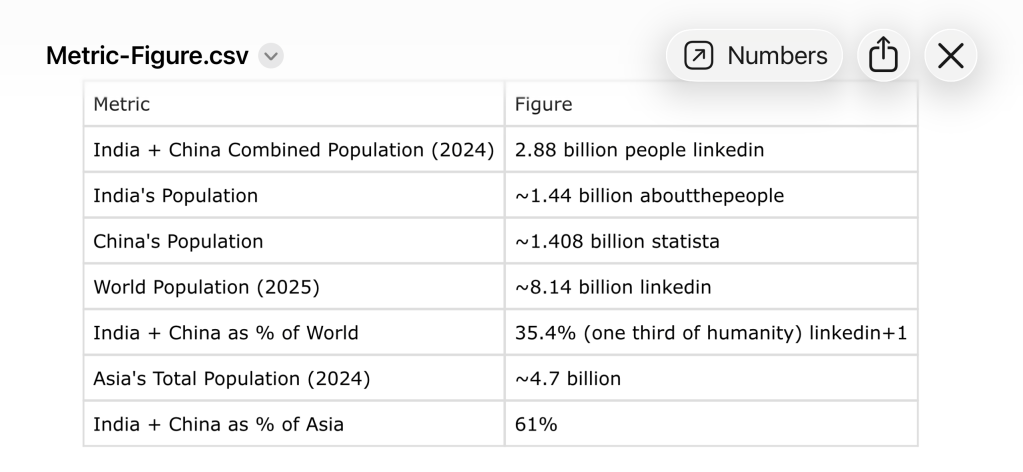
The staggering reality: One out of every three people on Earth is either Indian or Chinese. Together, they account for 35% of the world’s population and 61% of Asia’s population.
When 35% of humanity experiences the same inequality pattern, this is not a national problem—it’s a global crisis.
THE NUMBERS THAT STING
The 10-Year Wealth Grab (2014–2024)
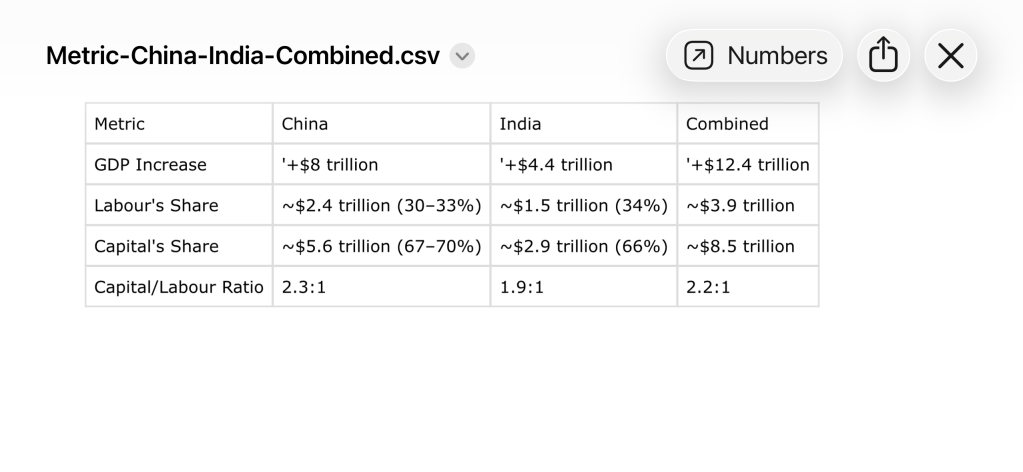
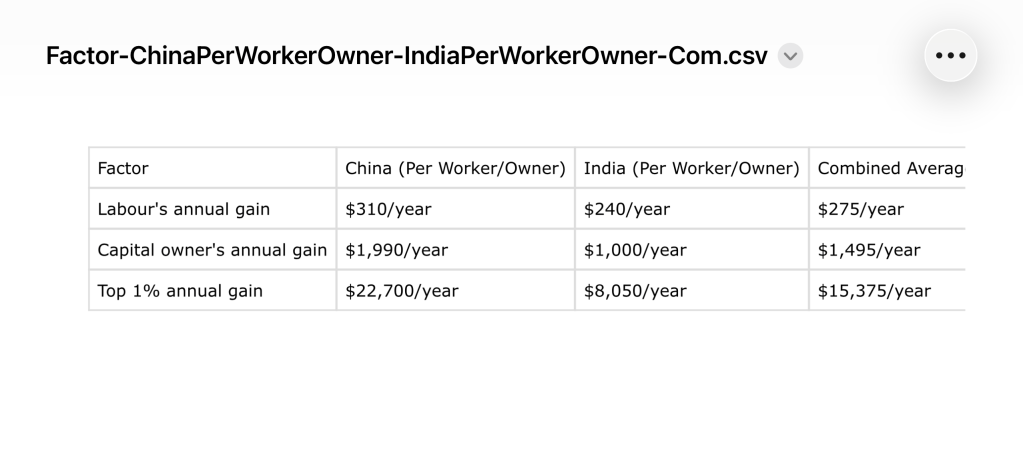
Capital owners get 6.4× more per person than workers in China, 4.2× more in India.
THE DEMOGRAPHIC DIVIDE THAT DOUBLES THE INJUSTICE
Population Sizes: Who Gets What (Combined 2.88 Billion)

The irony: China’s labour force is shrinking(aging population, -239 million workers by 2050) while India’s is growing (+144 million workers by 2050). Yet in both countries, workers are losing ground relative to capital.
THE GLOBAL RIPPLE EFFECT: WHY THIS ISN’T JUST AN INDIAN-CHINESE PROBLEM
The Adverse Turbulence for the World Economy
When 35% of humanity faces suppressed wages and extreme inequality, the global consequences are systemic, not local:
1. Suppressed Global Consumption
- 1.4 billion workers earning only $240–310/year more annually cannot drive global demand
- 570 million capital owners concentrate wealth rather than circulate it
- Result: Global consumption slowdown, trade deficits, protectionism
2. The “Middle Class Gap” in the World
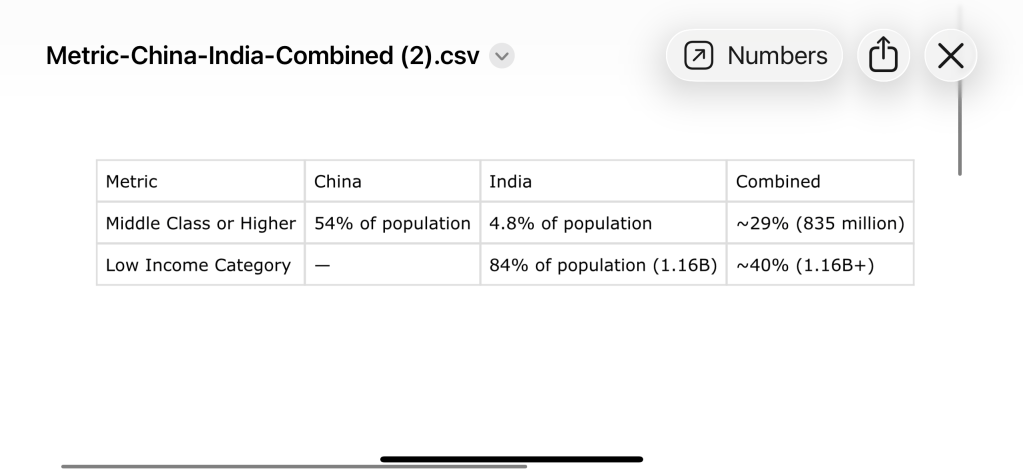
835 million middle-class consumers in China+India vs. 1.16+ billion trapped in low income creates a global demand vacuum.
3. Migration Pressures
- Labour suppression in both countries → internal migration (rural to urban)
- Economic desperation → international migration when domestic opportunities fail
- Prediction: 280 million new jobs needed in India by 2050 just to keep up
4. Financial Instability
- Capital concentration → speculative bubbles (real estate, stocks)
- Wealth inequality → political instability → market volatility
- China’s real estate bubble (land expropriation system) → global contagion risk
5. The “Between-Country” vs. “Within-Country” Inequality Paradox
- Global inequality BETWEEN countries is declining (China/India catching up to West)
- Inequality WITHIN countries is exploding (top 1% vs. bottom 50%)
- Net effect: Global inequality appears stable, but within-country turbulence is rising
6. Educational Inequality Creates Long-Term Productivity Gaps
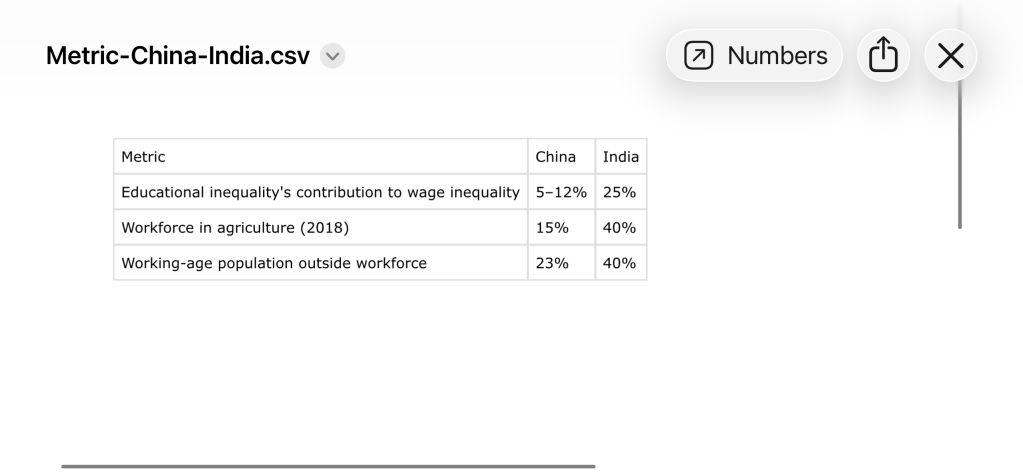
India’s neglect of compulsory primary education traps populations in low-productivity agriculture, creating a global productivity gap.
THE INEQUALITY PARALLEL: IDENTICAL OUTCOMES, DIFFERENT FLAGS
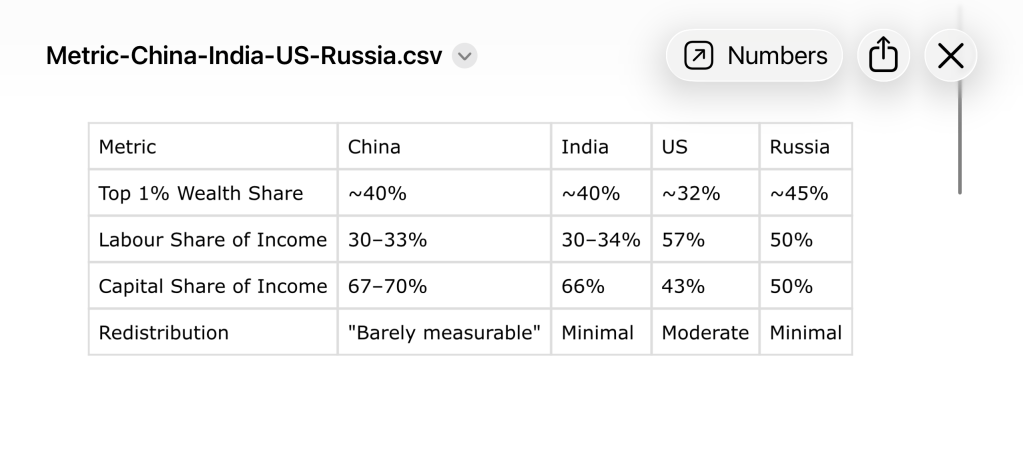
China and India now have inequality “almost as extreme as in the United States and Russia”.
The punchline: One country is authoritarian communist, the other is democratic capitalist. The outcome? Nearly identical.
THE STRUCTURAL MACHINE: WHY LABOUR ALWAYS LOSES
6 Institutional Features That Redirect Wealth to Capital
- Hukou/Migration Controls (China): Traps rural workers in low-wage labor, prevents urban wage competition
- State Ownership of Land (Both): Local governments expropriate land → real estate development → enriches capital owners
- Capital-Intensive State Sector (Both): Credit flows from state banks to capital, not workers
- Production-Based Taxation (Both): Taxes consumption/production, not wealth/property → regressive
- No Wealth/Property Taxes (Both): No redistribution from capital owners
- Weak Labor Protections (Both): Unionization rates ~10% (China), ~3% (India)
The result: “These structures are designed to maintain [Party/Government] control, enforce the priorities of the central state, and push rapid growth through high investment” — not to help workers.
THE POVERTY REDUCTION ILLUSION
Yes, China lifted 800+ million out of poverty. India lifted 250+ million. But this is about absolute growth, not distribution.
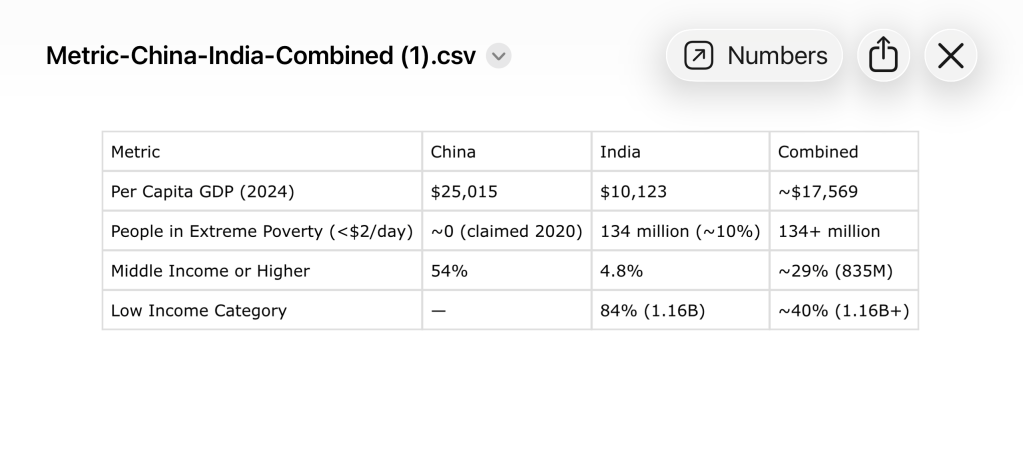
China’s workers are better off in absolute terms (2.5× higher per capita GDP), but the distribution is equally skewed.
THE FUTURE: INDIA’S DEMOGRAPHIC BOMB
Projection (2024–2050)
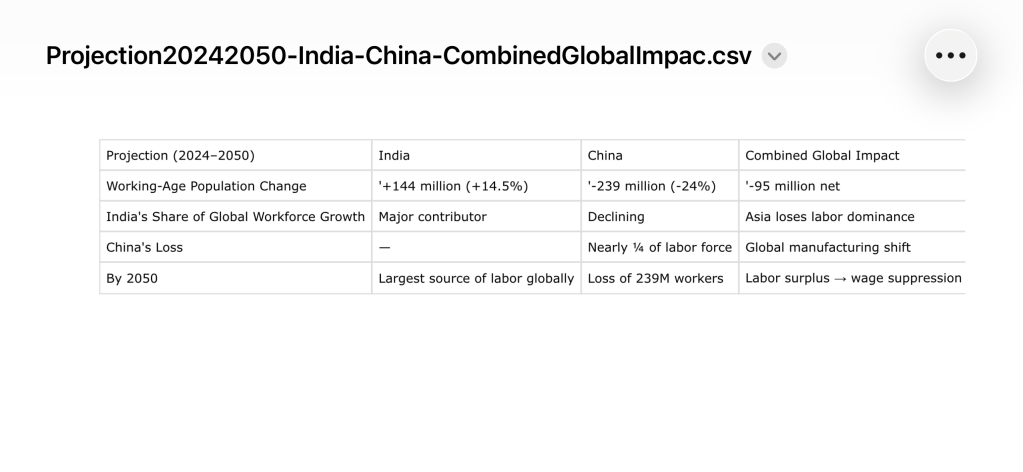
The cruel twist: India’s “demographic dividend” could become a demographic disaster if the same capital-heavy distribution continues. Adding 144 million workers while labour’s share stays at 34% means more workers competing for the same small slice of the pie.
Global consequence: If 144 million additional Indian workers face the same $240/year gain, that’s $34.5 billion/year in suppressed wages vs. potential $1.44 trillion if labour got 50% of GDP growth.
THE BOTTOM LINE: 35% OF HUMANITY IN THE SAME BOAT
Despite unusually high levels of state control over national assets and strong fiscal capacity, redistribution of income and wealth is barely measurable.”
Authoritarian communism did NOT produce better distribution than democracy. Both systems:
- Favor capital-intensive growth
- Suppress labour’s bargaining power
- Avoid wealth taxes
- Create oligarchies tied to political structures
The top 1% in both countries owns 40% of wealth. The top 20% captures 66–70% of income growth. Workers get 30–34%.
And this affects everyone because 35% of the world’s population lives in these two countries.
THE GLOBAL STORM BREWING
A textile worker in Dhaka, a factory worker in Shanghai, a gig driver in Mumbai, an IT contractor in Shenzhen—they are all in the same boat. Labour’s share of national income is declining globally, and China and India are not exceptions. They are the paradigm.
When 2.88 billion people (35% of humanity) experience suppressed wages and extreme inequality simultaneously, the ripple effects are global:
- Consumption slowdown → trade deficits → protectionism
- Migration pressure → political instability → market volatility
- Capital concentration → speculative bubbles → financial crises
- Productivity gaps → long-term growth stagnation
In 10 years, labour gained $310/year per person in China and $240/year in India. Capital gained $1,990 and $1,000. The top 1% gained $22,700 and $8,050.
The question is not whether China or India did better. The question is: Why does political system not matter when economic structure is identical?
The answer is uncomfortable: Capital always organizes faster than labour. Elites always control the state. And workers always pay the price.
And when 35% of humanity pays that price together, the turbulence reaches every corner of the global economy.
(Concluded)
Sudarshan Madabushi